Feature 1
Productivity Risks Dashboard
The biggest line item on your P&L, finally visible before the month closes. The dashboard quantifies the hours at risk across your active jobs, so you can see which are most likely to overrun — while there’s still time to act.
- Overmanning — when peak crew size outruns the plan and coordination overhead starts eating the gains.
- Dilution of supervision — when the worker-to-supervisor ratio climbs past what one leader can effectively run.
- Turnover / loss of learning — when crew churn resets the learning curve and drives lost hours.
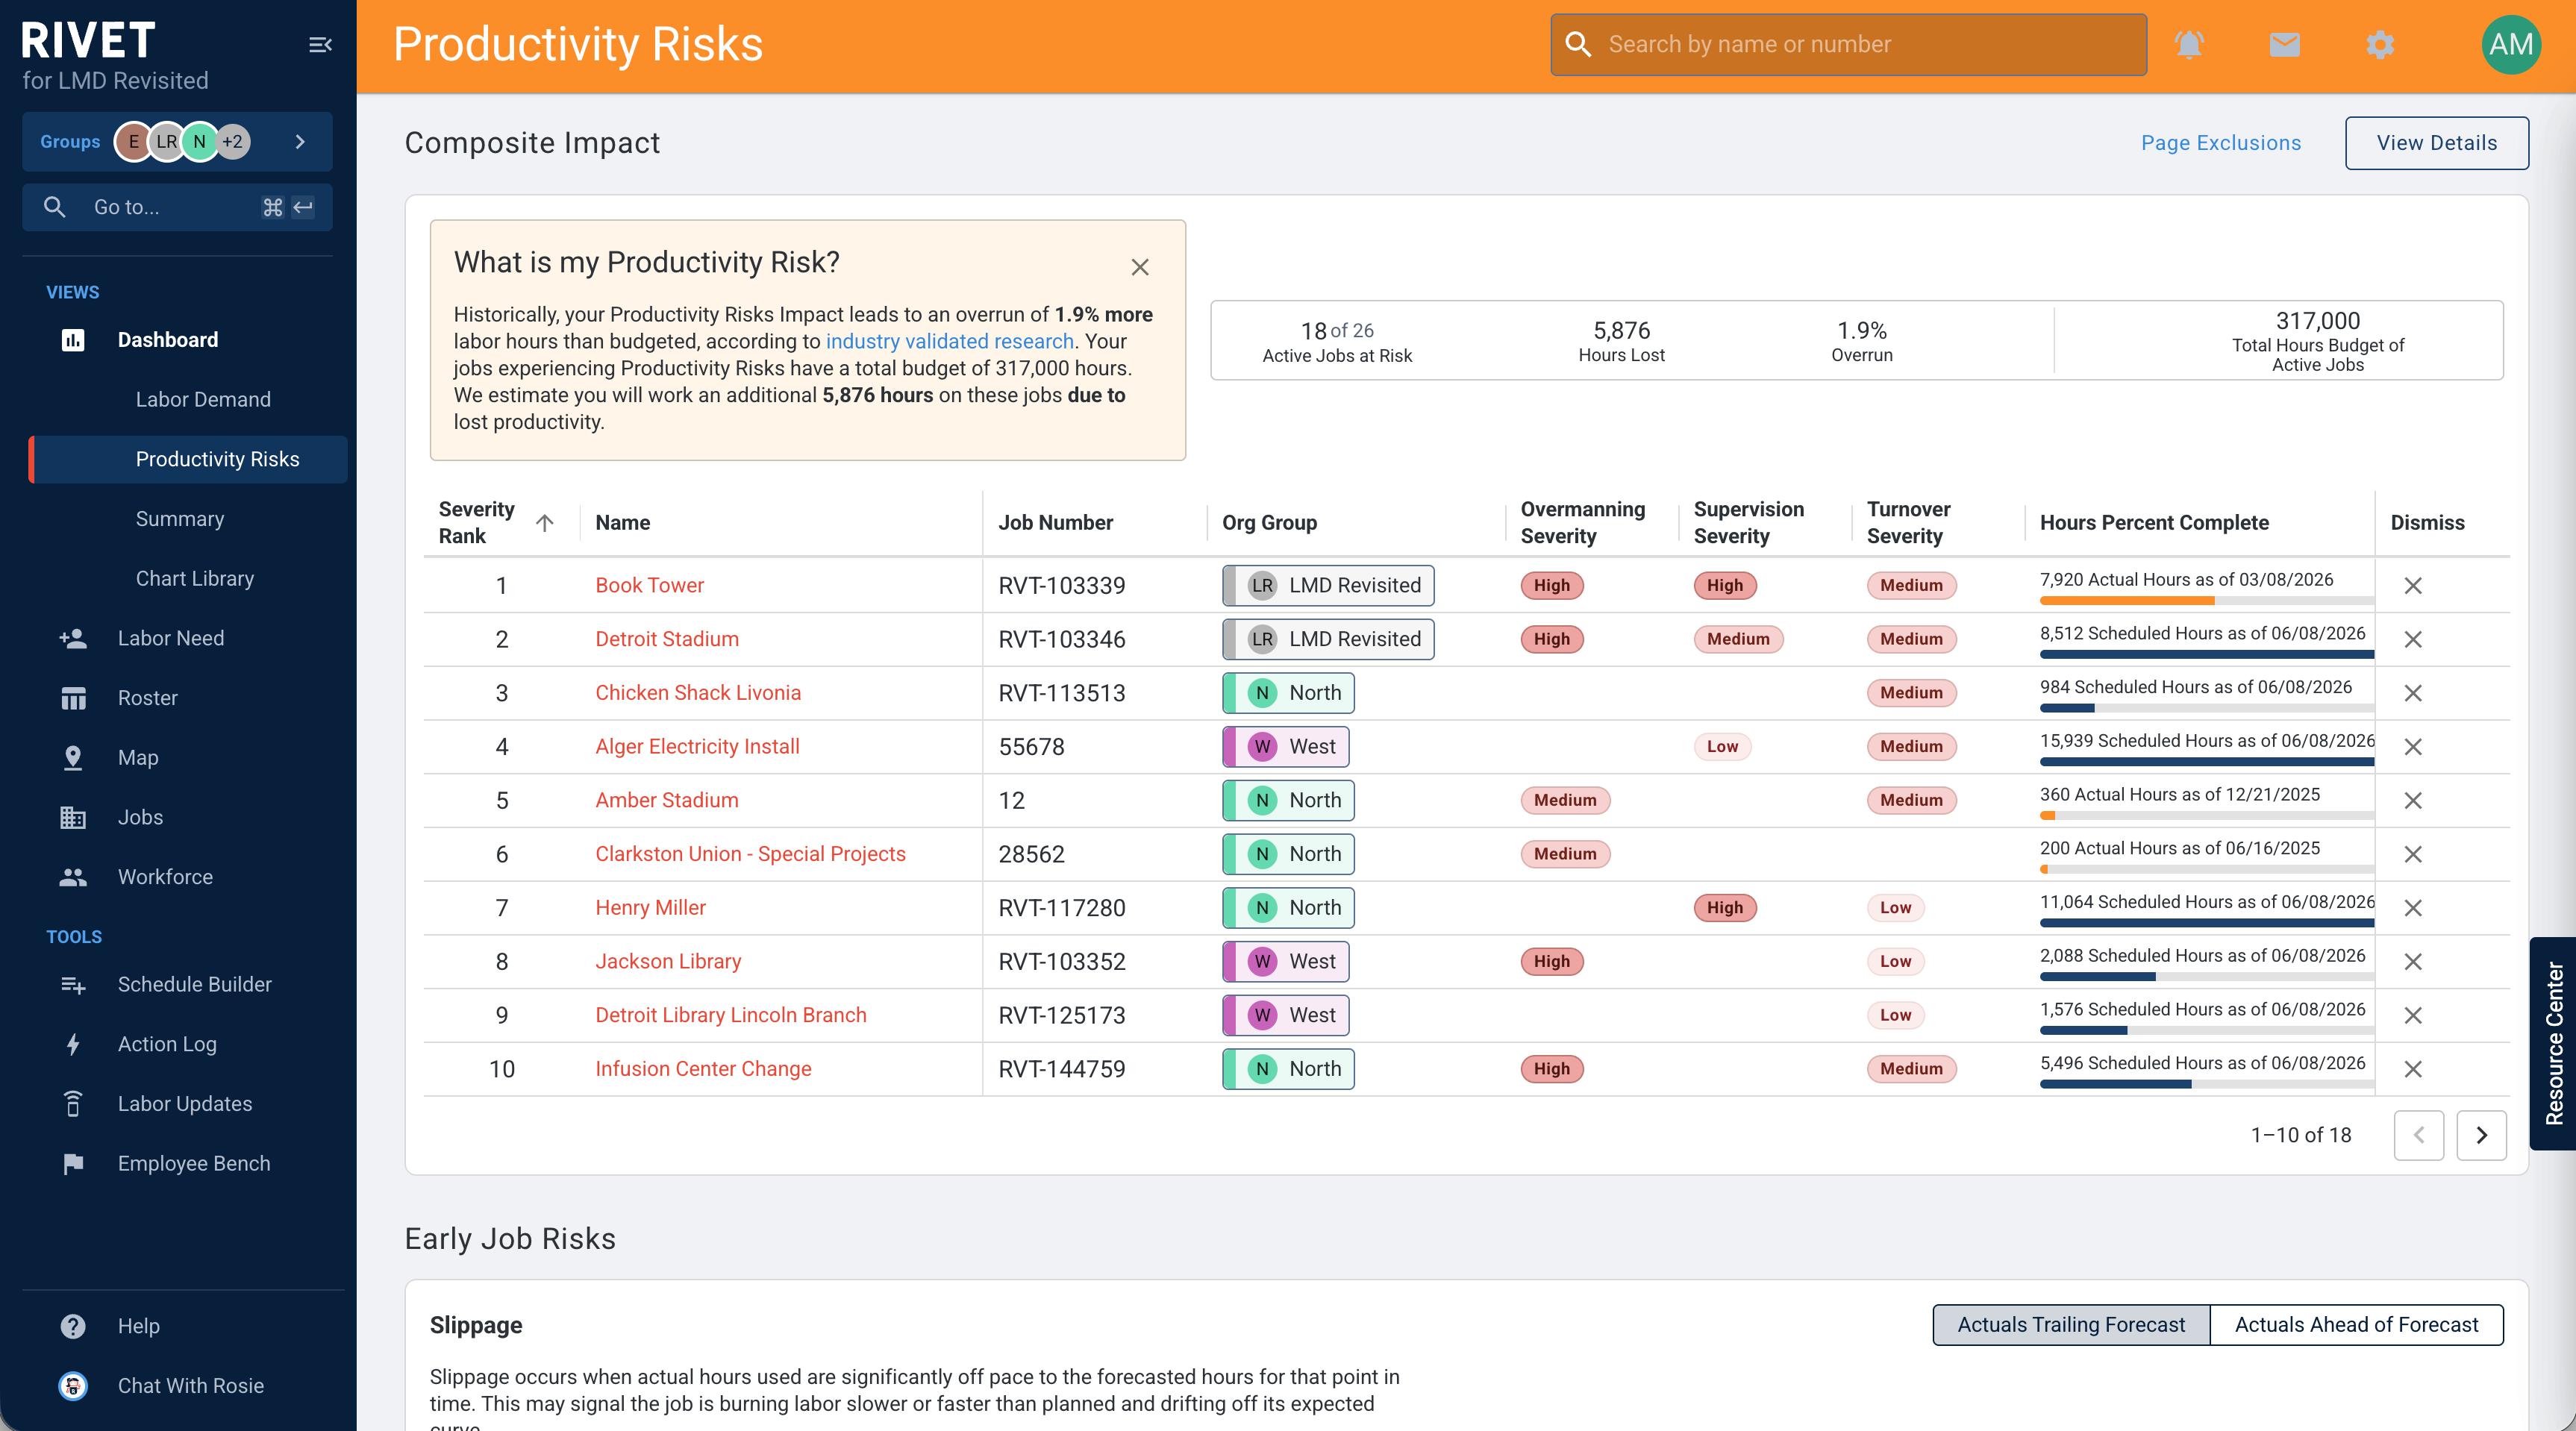
Leaders see the riskiest jobs across the whole portfolio at a glance.
Feature 2
Automated Initial Job Forecasting
A good forecast gives your coordinators a target to schedule against, feeds your labor demand analysis, and keeps everyone in sync. The catch is that someone has to build it — so jobs ramp up without a plan, or run against one that’s gone stale. We removed that step.
- Every new job gets a forecast auto-built from its start date, end date, and hours budget.
- As the schedule or budget shifts, the forecast keeps itself current — no manual upkeep.
- Once a job logs real hours or you edit it directly, RIVET steps back and the plan is yours.
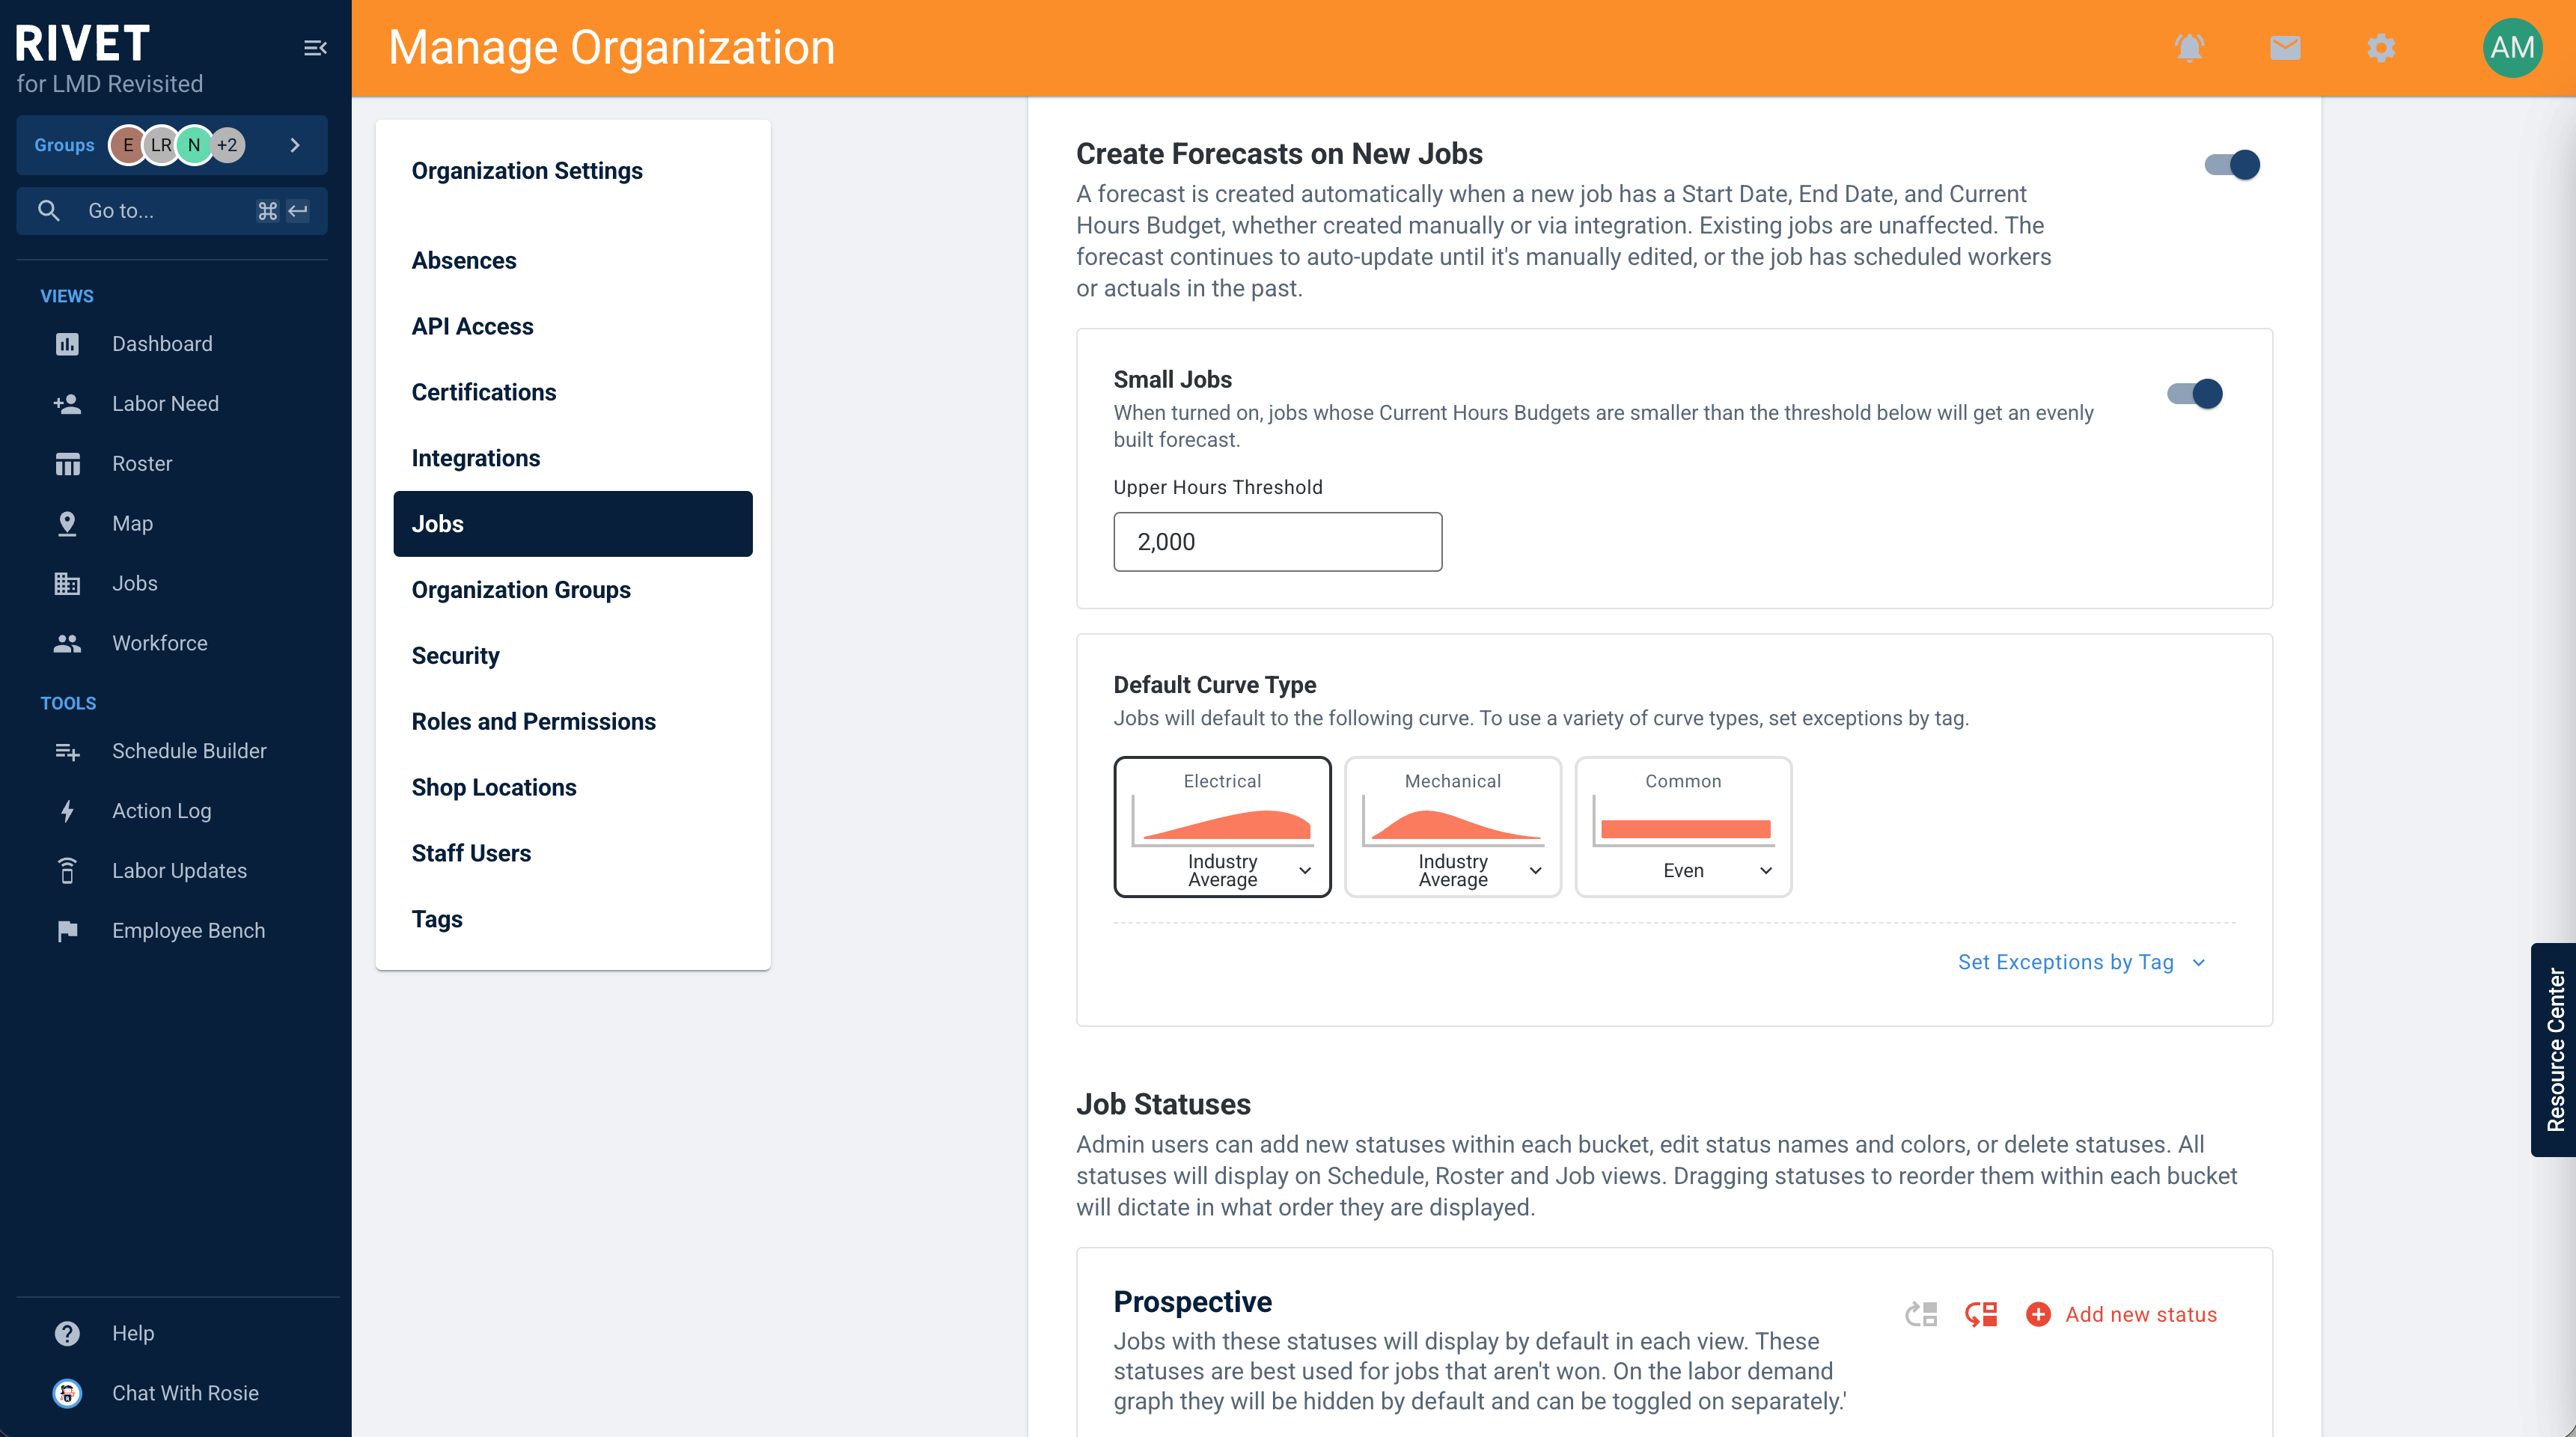
The forecast every job should have — finally built by default.